
Air Quality
dAio's environmental health continuously monitors the air quality around your sites to protect your staff and anticipate pollution episodes. Using each location's coordinates, dAio retrieves an air quality index (AQI) along with the breakdown of the main pollutants, turning raw data into an operational decision: postponing outdoor work, equipping a team, or simply keeping everyone informed.
Tip: pair environmental health with your alerts to be notified automatically as soon as an AQI threshold is crossed, without having to check the page manually.
Select a site
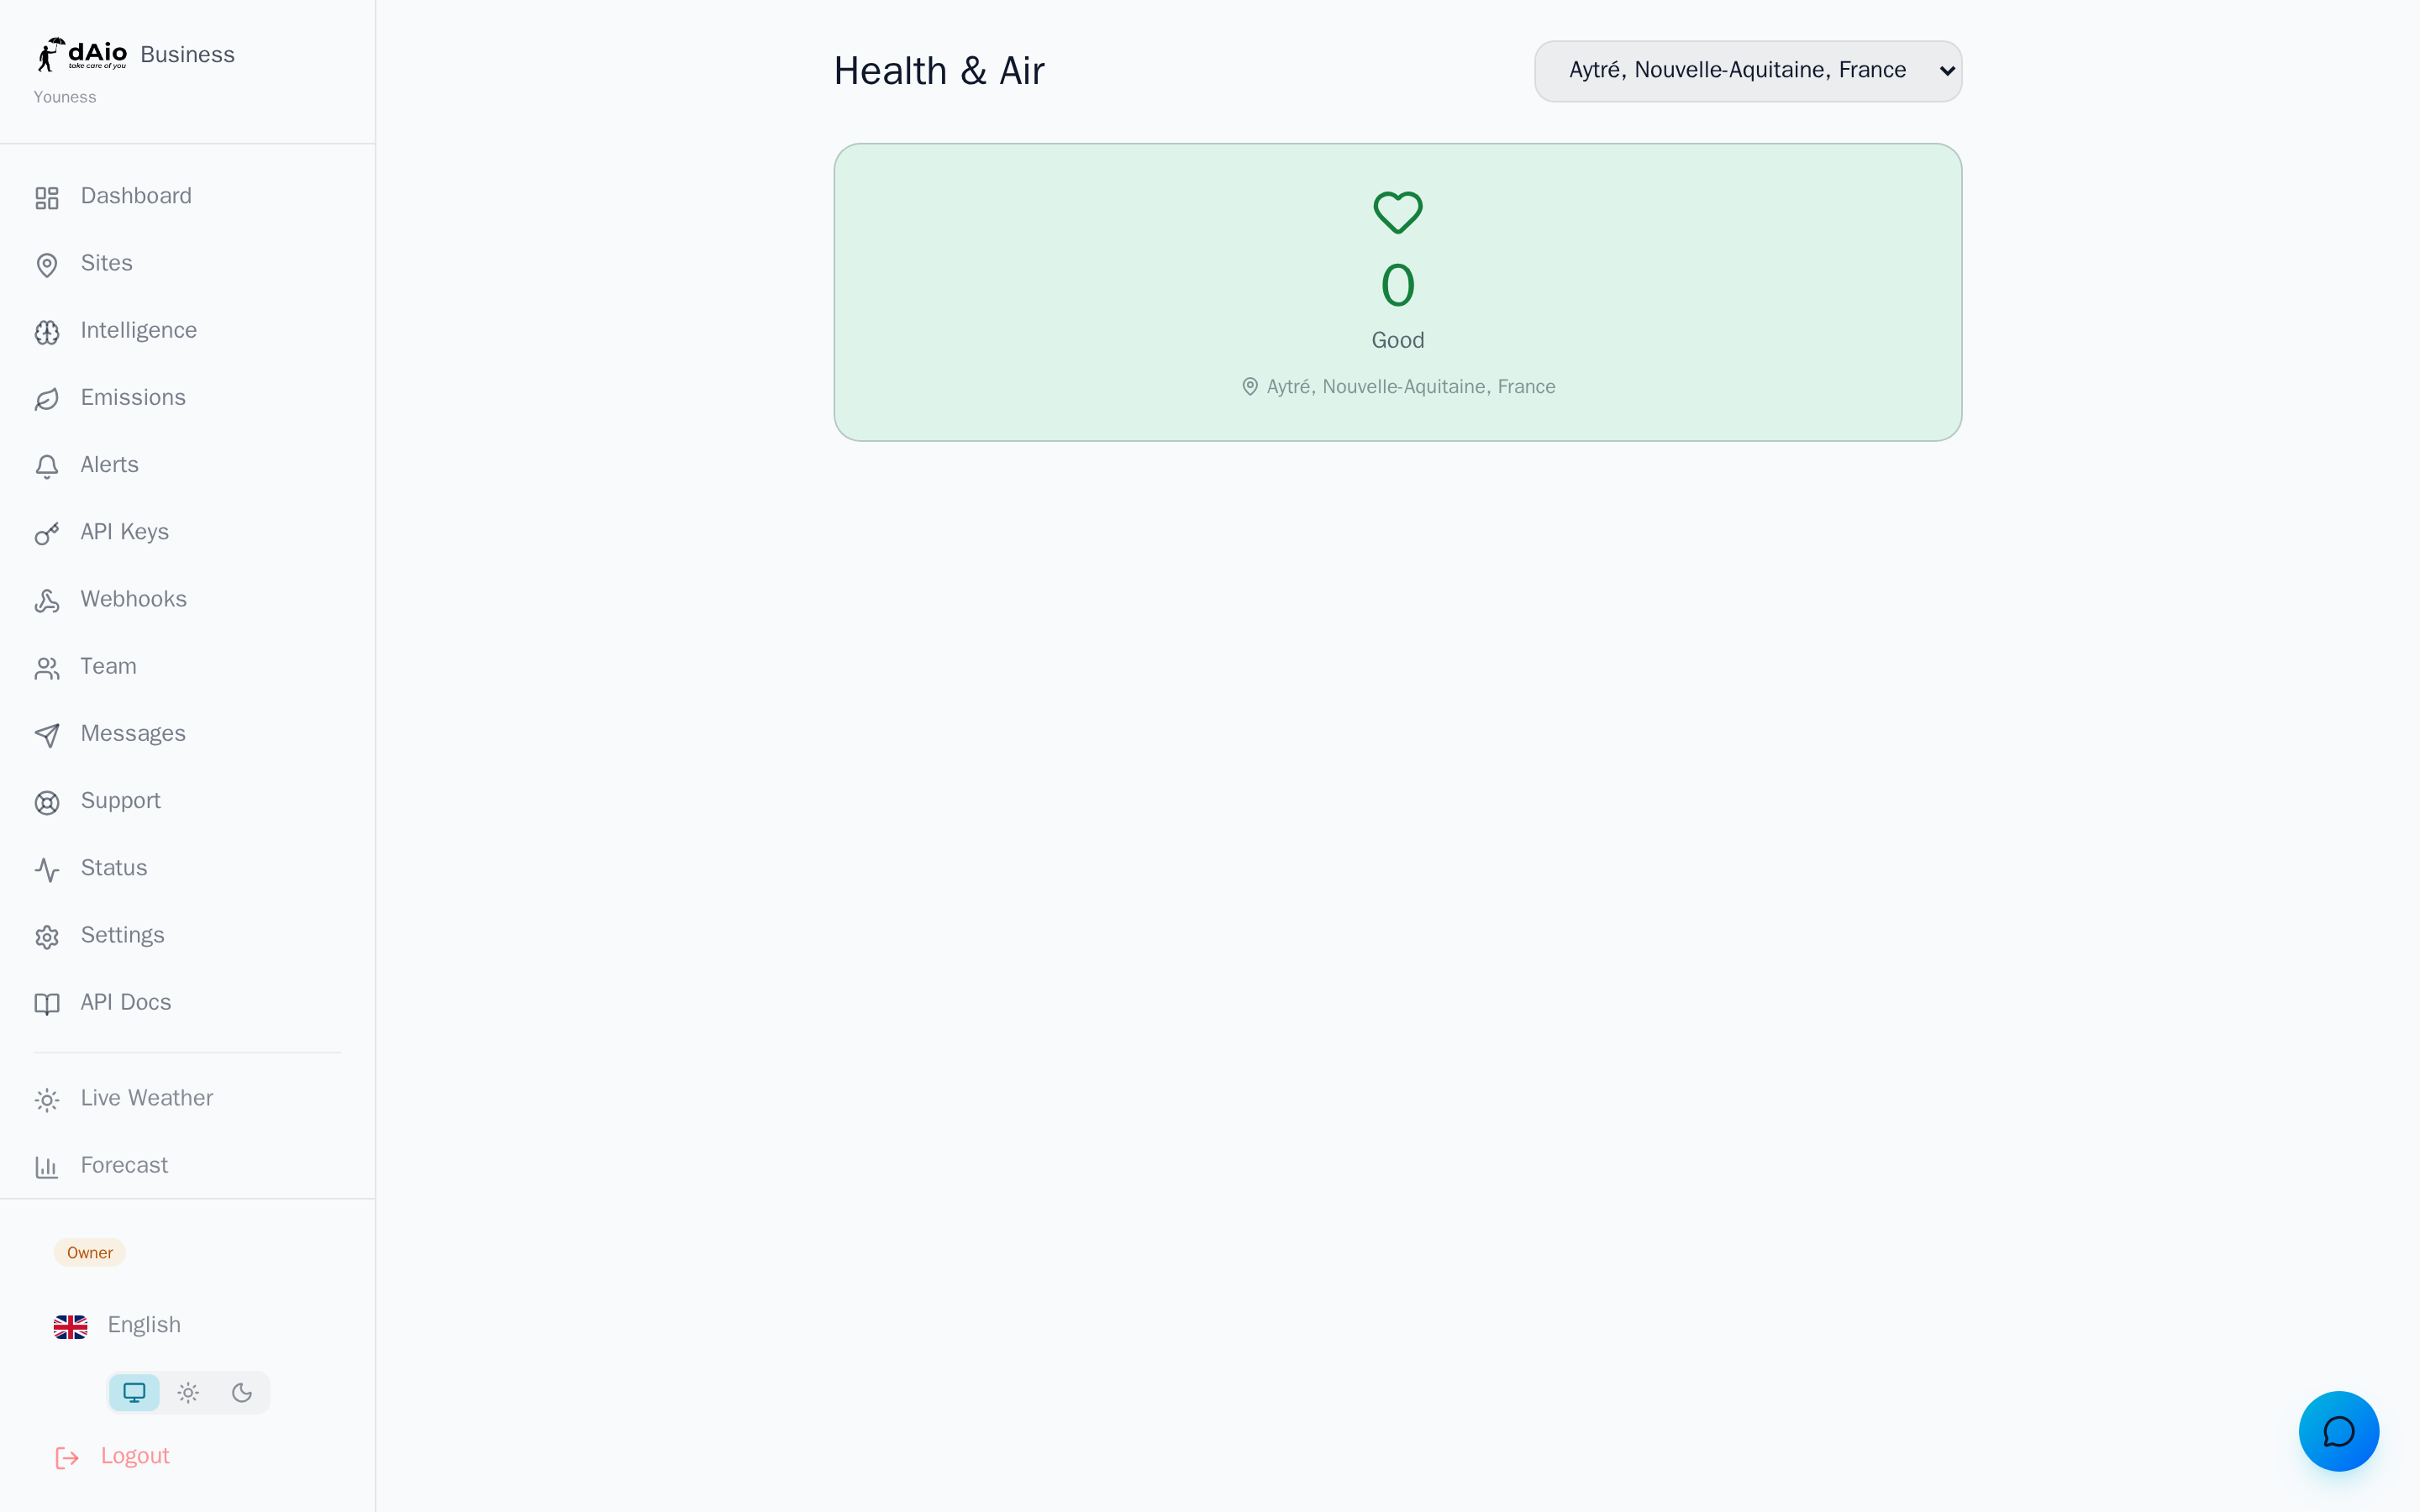
The Health tab displays the air quality for the first of your sites. If your organization has several, a dropdown in the top right lets you switch instantly from one location to another. Data is computed from the exact latitude and longitude of the selected site.
Caution: if no data appears, make sure the site has valid coordinates. A poorly geolocated location prevents the index from being retrieved. See the Sites page to correct its coordinates.
Understanding the AQI
The air quality index (AQI) summarizes the air pollution level in a single number. The higher the value, the worse the air. dAio highlights the index and pairs it with a color-coded risk level:
| Level | AQI | Color | What it means |
|---|---|---|---|
| Good | 0-50 | Green | Satisfactory quality, no health risk. |
| Moderate | 51-100 | Yellow | Acceptable, low risk for sensitive people. |
| Unhealthy for sensitive groups | 101-150 | Orange | Sensitive groups may feel effects. |
| Unhealthy | 151-200 | Red | Possible health effects for everyone exposed. |
| Hazardous | > 200 | Purple | Health alert: limit outdoor exposure. |
Tip: "sensitive groups" include people with asthma, the elderly, pregnant women, and those with respiratory or cardiac conditions. Adjust the organization of outdoor work accordingly.
Pollutants measured
Below the overall index, dAio details the concentration of the main air pollutants, expressed in micrograms per cubic meter (µg/m³):
| Pollutant | Description |
|---|---|
| PM2.5 | Fine particles under 2.5 microns, the most penetrating for the respiratory tract. |
| PM10 | Suspended particles under 10 microns (dust, pollen, soot). |
| O₃ (Ozone) | Ground-level ozone, a respiratory irritant that peaks under strong sunlight. |
| NO₂ | Nitrogen dioxide, a marker of road traffic and combustion. |
| SO₂ | Sulphur dioxide, from industrial processes and sulphurous fuels. |
| CO | Carbon monoxide, a gas produced by incomplete combustion. |
Only pollutants actually reported for the site and period are shown. Values come from the /api/weather/air-quality endpoint, fed by the site's coordinates.
Tip: monitor PM2.5 and O₃ as a priority. They are the two indicators most closely correlated with health peaks on worksites and exposed locations.
Enabling the feature
Environmental health is a feature whose availability depends on your subscription and its configuration. When it is included in your plan, enable it under Settings > Features. If the Health tab does not appear, check your plan or reach out to the organization owner.
Best practices
- Enter precise coordinates for each site: AQI reliability depends directly on them.
- Set alert thresholds via the Alerts section rather than checking the page case by case (for example AQI > 100 for sensitive groups, AQI > 150 for everyone).
- Cross-reference with weather intelligence: strong sunlight or a lack of wind favor the accumulation of ozone and particles.
- Inform your field teams: share the day's risk level with site referents to adapt outdoor work.
- Track episodes over time: note recurring peaks to schedule sensitive operations during the most favorable periods.
Caution: air quality indices are modeled estimates for informational purposes. For regulatory obligations or situations with a proven health risk, rely on official measurements and the instructions of the relevant authorities.