
Weather-business intelligence
Weather-business intelligence is the analytical heart of dAio Business. It turns a raw weather forecast into operational decisions, read through the lens of your industry. Where a consumer weather app simply announces "12 mm of rain", dAio tells you what that actually means: a site at a standstill, a grape harvest to postpone, a delivery round at risk — or, on the contrary, the ideal window to pour concrete.
Every site you monitor receives a risk score tailored to its industry, over a 16-day horizon, along with the warnings and opportunities of the moment and an hour-by-hour breakdown. This same analysis powers your alerts and feeds the return-on-investment estimate.
Tip: from the site list, the Analyze button opens the intelligence for that site directly, with its industry and coordinates already loaded.
The principle: weather read through your industry
The same weather condition does not carry the same meaning for every activity. Heavy rain is critical for a construction site, yet it can be a welcome opportunity for a farm during a dry spell. A 45 km/h wind grounds a crane but boosts the output of a wind farm.
dAio therefore applies an industry profile to each site: a set of thresholds and rules specific to your business (wind, rain, frost, visibility, humidity, UV, and so on). From the site's forecast, the engine computes a daily score, flags the risks specific to your activity and spots the usable windows.
Tip: score calculation is deterministic (based on business rules, not a generative model). Viewing a site's intelligence, its hourly breakdown and its scores does not consume your AI quota — which is reserved for natural-language recommendation features.
Choosing the site and the industry
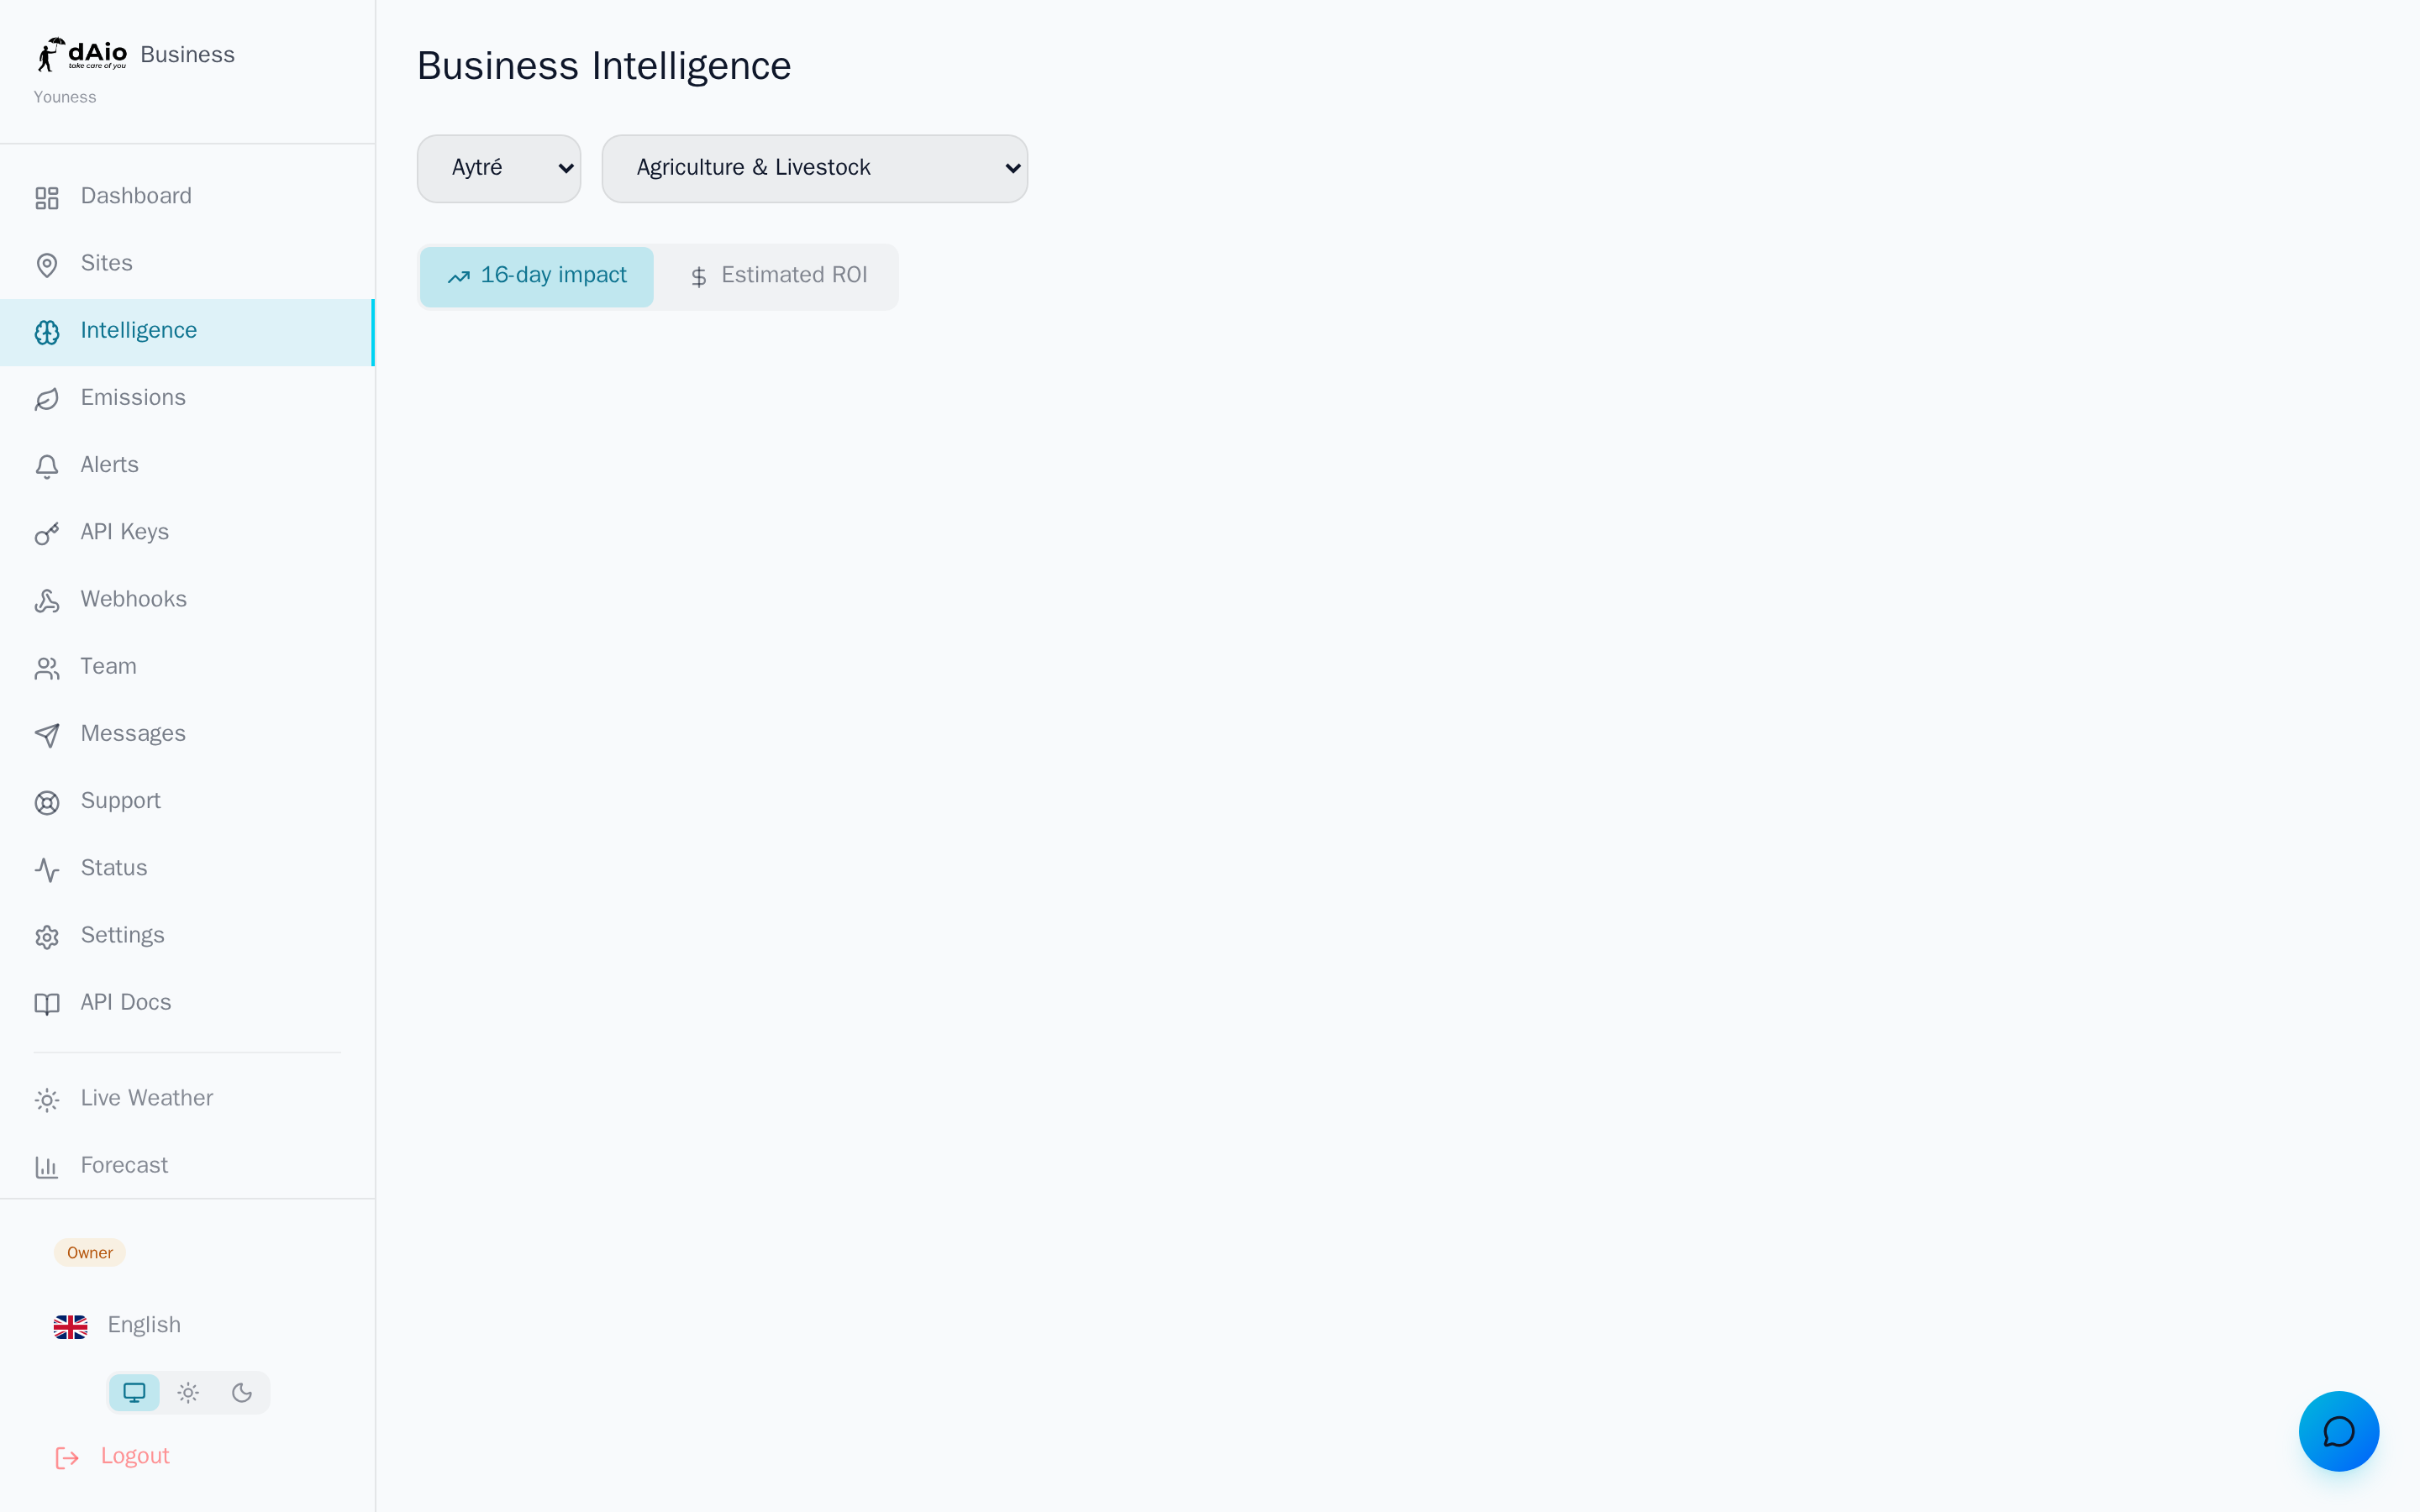
Two selectors at the top of the page drive the entire analysis.
The site
The Site dropdown lists your locations. Select the one to analyze: its coordinates determine the forecast used. City names are automatically displayed in your interface language.
If you haven't declared any site yet, the page prompts you to create one — without an anchor point, no analysis is possible.
The industry
The Industry menu defines the reading grid applied. By default, dAio uses your organization's industry, but you can switch on the fly to compare different grids. Seven profiles are available:
| Industry | Decisive parameters |
|---|---|
| Construction | Rain, wind and gusts, frost, heatwave, storm |
| Logistics & Transport | Rain, visibility (fog), snow, black ice, wind |
| Agriculture & Livestock | Rain, frost, heat, wind (spraying), humidity, drought |
| Events | Rain, wind, temperature, storm |
| Retail & Terraces | Temperature, precipitation, sunshine |
| Energy | Cloud cover (solar), wind (wind power), consumption peaks |
| Municipality & Public bodies | Roads, snow and ice, wind, storm, heatwave and cold snap, fog |
The horizon
The analysis covers 16 days. The bar chart at the top of the page summarizes the daily score over the whole horizon; the hourly breakdown is available for the first 7 days, where the forecast is most reliable.
Reading the risk scores
The risk score is an index from 0 to 100 computed each day for the site + industry pair. 0 = ideal conditions, 100 = activity impossible. It reads at a glance thanks to the color code:
| Score | Level | Color | Reading |
|---|---|---|---|
| 0–9 | Optimal | Green | Ideal conditions, plan without reservation |
| 10–24 | Low | Cyan | Favorable conditions, minimal caution |
| 25–49 | Moderate | Amber | Real constraints, expect adjustments |
| 50–79 | High | Red | Activity heavily disrupted, consider postponing |
| 80–100 | Critical | Dark red | Extreme conditions, activity to avoid |
The bar chart shows the 16-day trend: a single glance is enough to spot the green window to favor or the red peak to anticipate. Hover over a bar to display the score and its level.
Below the chart, one card per day details the date, the weather summary (min/max, maximum wind, rainfall total) and the day's score as a colored badge.
Warning: the same site changes score from one industry to another. Always check that the selected industry matches the activity actually carried out on that site before making a decision.
Warnings and opportunities
For each day, the intelligence does not stop at a number: it spells out why.
- Warnings (⚠, amber): the precise risks for your business — frost on a site, excessive wind for agricultural spraying, dense fog on a delivery round, a storm over an outdoor event.
- Opportunities (✓, green): the favorable windows to seize — an ideal slot to pour concrete, perfect harvesting or sowing conditions, a sunny day driving terrace footfall.
These messages are context-aware: a rainfall total will trigger a "heavy rain — stop" warning for construction, but an opportunity for agriculture in a drought context.
Tip: first scan the score timeline to frame the week, then read the warnings and opportunities of the pivotal days to decide what to postpone and what to bring forward.
The hourly breakdown
Click Show hourly on a daily card to expand the hour-by-hour table. Each column corresponds to one hour; the rows cover:
- Weather (icon) and temperature / feels-like
- Wind and gusts (km/h), with localized direction
- Rain (mm) and probability (%)
- Humidity (%), UV and cloud cover (%)
Critical values are highlighted automatically: wind and gusts turn amber then red beyond the caution thresholds, rain and high humidity stand out in blue, a high UV in red. This level of detail lets you set an operation on the right slot within the day — for example in the morning before the wind picks up, or a lull between two showers.
Usable windows
Beyond the daily score, the intelligence reasons in workable days: over the analyzed horizon, dAio distinguishes the days where activity remains possible from those where it is not, according to your industry's thresholds. This is the basis for realistic two-week planning: cluster sensitive tasks on the favorable windows and keep the degraded days for sheltered work or maintenance.
For a targeted question such as "when can I spray this week?", dAio identifies the time slots combining the right conditions (for example: dry, light wind, over a minimum useful duration).
Operational use by industry
The intelligence is read differently depending on the business:
- Construction — Secure sensitive operations (pouring, crane, roofing) on the green windows; anticipate frost, heatwaves and storms that force a halt to outdoor work.
- Logistics & Transport — Spot fog, black ice, snow and strong wind to adjust rounds, schedules and alternative routes.
- Agriculture & Livestock — Time sowing, harvesting, grape picking, haymaking and treatments; watch for spring frost, heat stress and dry spraying windows.
- Events — Decide whether to maintain, go to plan B (marquees) or postpone; monitor rain, wind, heat and storm on the day.
- Retail & Terraces — Anticipate footfall, open terraces on the right days, adjust stock (cold/hot drinks) and staffing to the weather.
- Energy — Anticipate solar output (cloud cover) and wind output (wind regime), and consumption peaks during heatwaves or cold snaps.
- Municipality & Public bodies — Trigger winter road service, heatwave/cold-snap plans and the securing of public events; monitor roads, snow, ice and storms.
How it fits with the rest of dAio
The intelligence is not a standalone view:
- The scores and rules presented here feed your alerts, which notify you automatically as soon as a threshold is crossed on a site.
- For a more raw weather reading (multi-day forecast, model comparison), refer to the forecasts.
- To quantify the economic value of this anticipation, the ROI tab — reserved for the owner and administrators — is detailed in Intelligence & ROI.
Best practices
- Check the industry before any decision: it is what gives the score its meaning.
- Read the 16-day timeline first, then zoom into the hourly breakdown of the pivotal days to set your operations down to the hour.
- Exploit the opportunities, not just the warnings: bringing a task forward onto a green window is often better than enduring a postponement.
- Cover your critical sites first and assign them to a field lead who will track their intelligence and alerts.
- Turn analysis into a reflex: set up alerts so you no longer have to open the page every morning.
Tip: a weekly planning point based on the 16-day timeline, followed by an hourly check the day before each sensitive operation, is enough to turn the weather into an operational advantage rather than a hazard endured.