
ROI Calculator
dAio's ROI calculator turns weather-business intelligence into euros. In a few seconds, it quantifies the losses you avoid by anticipating high-risk days and compares that gain to the cost of your subscription — giving you hard numbers to demonstrate the platform's value to your management.
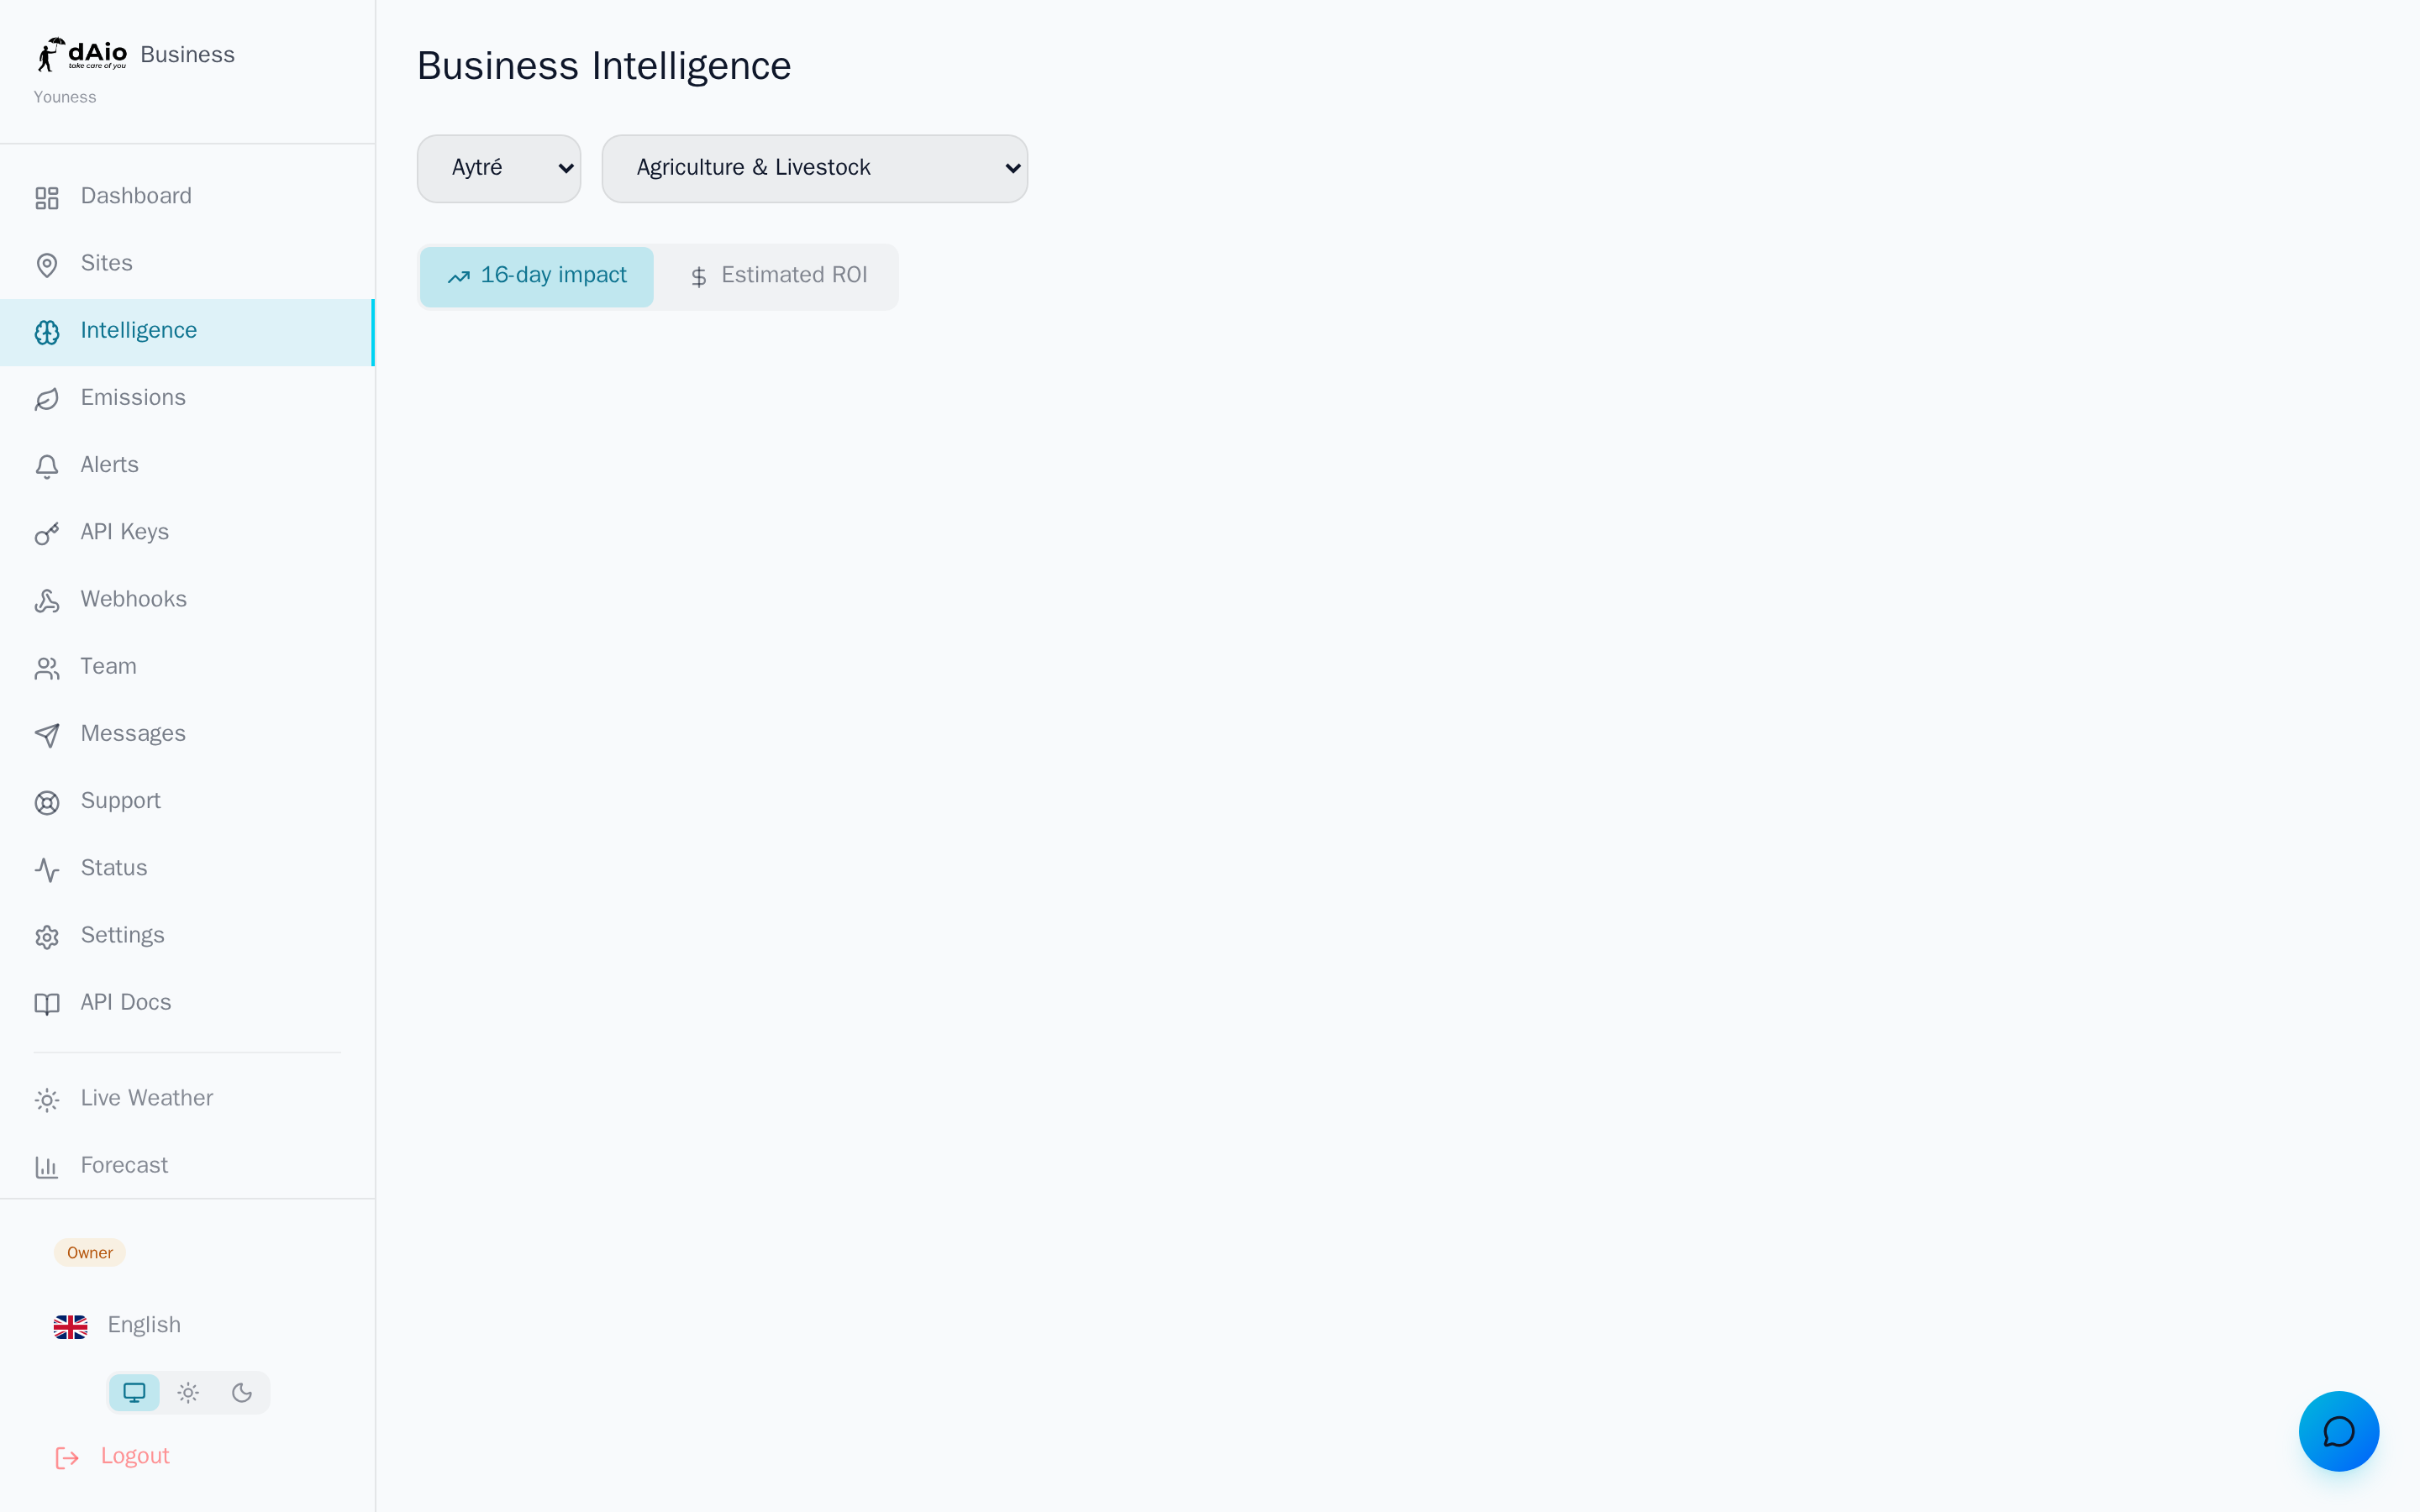
It lives in the Business Intelligence page, ROI tab, alongside the weather impact analysis.
Tip: the ROI tab is reserved for the organization owner and administrators. It is the ideal tool to prepare a board meeting or justify the subscription budget.
Principle
Every workday halted by weather has a cost: idle labor, stopped equipment, late penalties, lost goods. By anticipating those days, you reorganize work and avoid part of those losses. The calculator weighs:
- the savings generated by anticipating high-risk days;
- the cost of your dAio subscription over the same period;
- the resulting net benefit and return on investment (ROI).
Set the context
Two selectors at the top of the page drive the calculation:
- Site — the location analyzed. See Sites.
- Industry — it pre-fills the parameters with reference values specific to your business.
Default values by industry:
| Industry | Cost per down day | Impacted days / month |
|---|---|---|
| Construction | €8,000 | 3 |
| Logistics | €2,500 | 4 |
| Agriculture | €5,000 | 2 |
| Events | €15,000 | 1 |
| Retail | €1,500 | 5 |
| Energy | €3,000 | 3 |
Tip: these values are only a starting point. Refine them with your real figures (next section) for a credible estimate.
Customize the parameters
Click Customize to adjust three parameters:
- Cost per down day (€) — the average cost of a lost workday.
- Impacted days per month — the number of weather-sensitive days per month (0 to 30).
- dAio cost per month (€) — your subscription amount (€49 by default).
Choose the period
Three analysis horizons are available: Month, Year, or 3 years. The selected period applies to every indicator and to the chart.
Read the results
Four key indicators are shown for the selected period:
| Indicator | Meaning |
|---|---|
| Savings | Losses avoided through anticipation. |
| dAio cost | Subscription amount over the period. |
| Net benefit | Savings minus cost. Shown in red if negative. |
| ROI | Return on investment, as a percentage. |
A break-even box shows in how many days the subscription pays for itself. Over the Year and 3-year periods, a cumulative chart overlays savings (green), cost (red), and net benefit (dashed purple) month after month.
Methodology
The calculation is transparent; it is recalled at the bottom of the tab:
Monthly savings = Cost per day × Impacted days per month
ROI = (Savings − dAio cost) / dAio cost × 100
Break-even equals the monthly dAio cost divided by the average daily savings.
Caution: the calculator provides an estimate, not a guarantee. Real savings depend on your ability to turn alerts into decisions (rescheduling, securing, redeployment). No action, no savings.
Best practices
- Start from your real figures rather than the defaults: the result only carries weight if it reflects your activity.
- Be conservative on cost per day and impacted days; a credible ROI convinces better than a spectacular figure.
- Think in terms of 3 years to smooth out seasonality and present a multi-year vision to your management.
- Tie ROI to action: configure alerts so that every high-risk day actually triggers a decision.
- Document your assumptions: note the source of your costs so you can defend them at the board.
Tip: combine the ROI calculator with the impact analysis of the same site — one quantifies the value, the other concretely identifies the days to anticipate.