
Emissions — Overview
The Emissions module turns dAio Business into a true carbon accounting tool. It lets you measure, declare and reduce your organization's footprint, in compliance with the major regulatory frameworks. Every emission source — a generator on a site, an electricity bill, a business trip — is converted into tonnes of CO₂ equivalent (tCO₂e) using recognized emission factors, then consolidated into a single dashboard.
Where most organizations exhaust themselves rebuilding their carbon footprint once a year in a spreadsheet, dAio maintains it continuously: you enter your data once, and the platform recalculates, identifies your priorities and generates the official reports on demand.
Tip: before you start, declare your sites. Carbon tracking is more precise when tied to real locations, and some sources (equipment, invoices) relate directly to them.
The framework: Scopes, GHG Protocol and standards
Carbon accounting is built on the GHG Protocol, which splits emissions into three perimeters (scopes). dAio applies this structure end to end.
| Scope | Nature | Typical examples |
|---|---|---|
| Scope 1 | Direct emissions, from sources you control | Generators, vehicle fleet, construction machinery, on-site combustion |
| Scope 2 | Emissions from purchased energy | Electricity, natural gas, district heating |
| Scope 3 | Indirect emissions from your value chain | Business travel, purchases, upstream transport, waste |
dAio's methodology aligns with the international quantification standards — GHG Protocol and ISO 14064 — and feeds the main regulatory reporting frameworks:
- EU CSRD / ESRS — Corporate Sustainability Reporting Directive and its ESRS standards (Europe)
- UAE MOCCAE — Ministry of Climate Change and Environment (United Arab Emirates)
- SEC Climate Disclosure — Securities and Exchange Commission (United States)
- TCFD — Task Force on Climate-related Financial Disclosures
Tip: start with Scopes 1 and 2, which are easier to document (equipment and invoices). Scope 3, often the largest, is built up gradually through the Indirect tab.
Reading the carbon dashboard
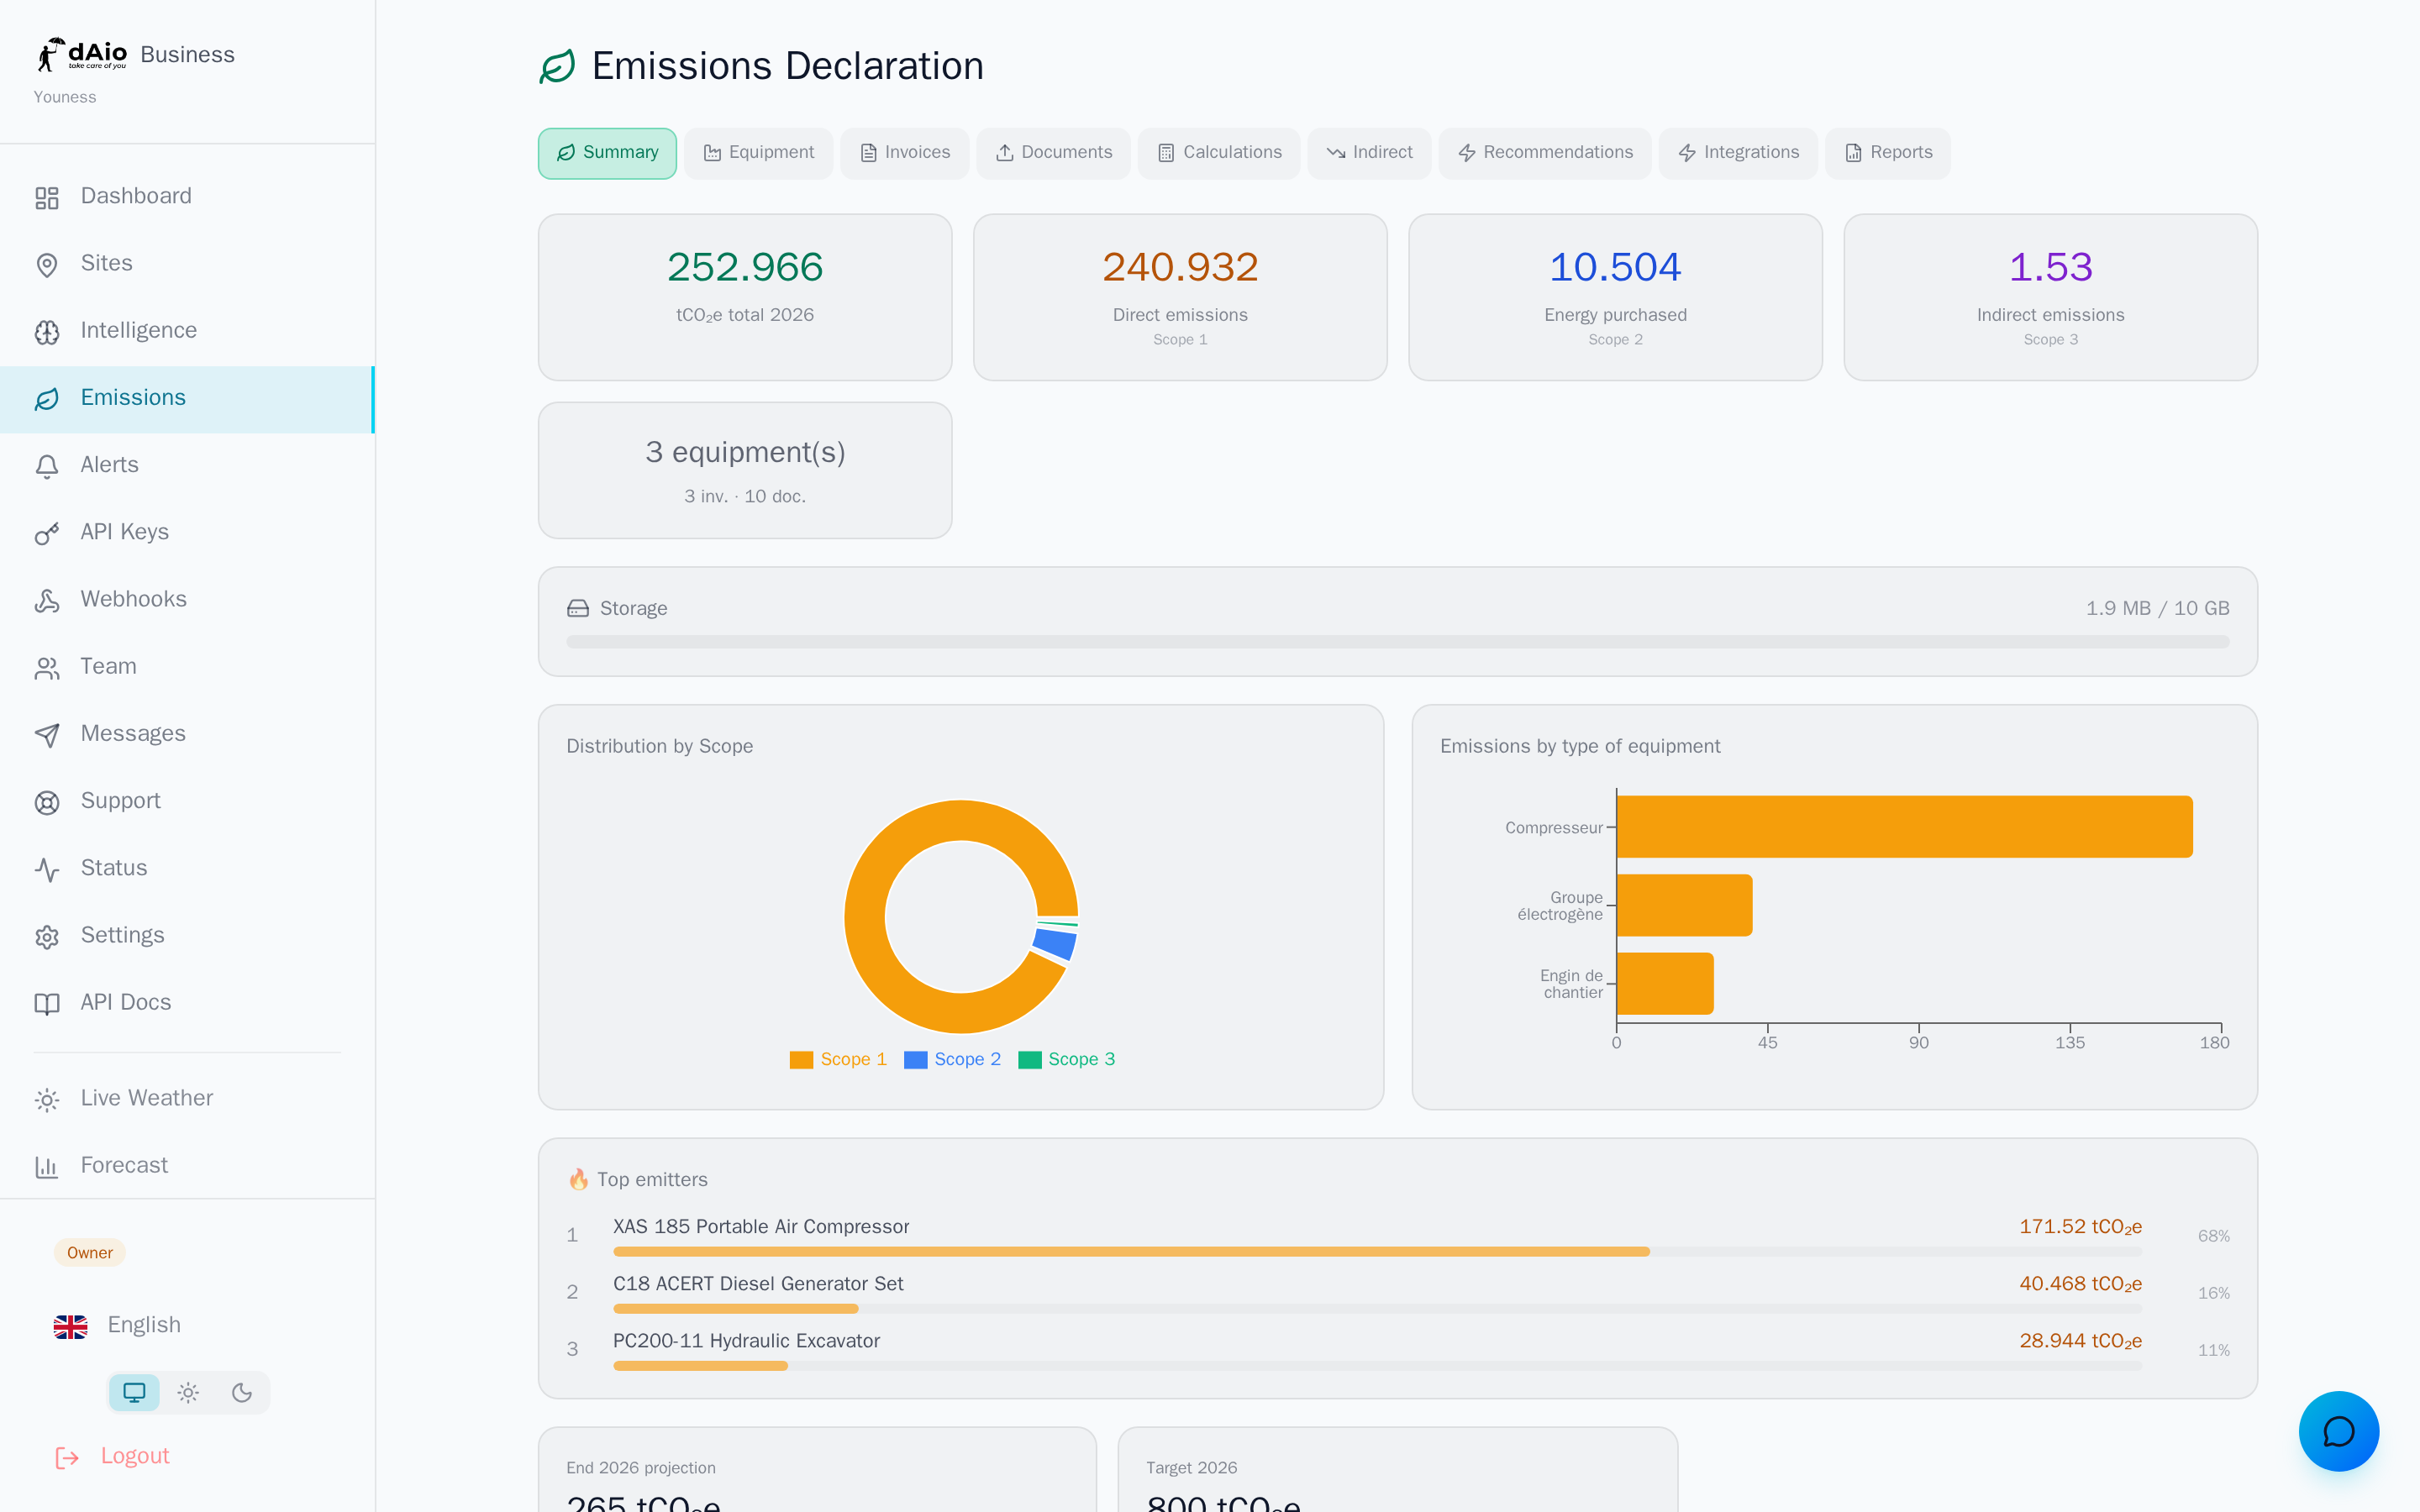
The Summary tab (the first tab, open by default) condenses the state of your footprint. It is made up of several blocks.
Key indicators (KPIs)
At the top of the page, a row of cards shows, for the current year:
- Total tCO₂e — the sum of all your scopes, your reference figure.
- Direct emissions (Scope 1) — combustion and fleet.
- Purchased energy (Scope 2) — electricity and gas.
- Indirect emissions (Scope 3) — shown as soon as indirect data exists.
- Inventory — number of equipment items, invoices and documents taken into account.
A storage bar shows the space used by your documents (invoices, datasheets) against your plan's quota.
Breakdown and trend
| Visualization | What it shows |
|---|---|
| Distribution by scope | Donut chart: the relative weight of Scopes 1, 2 and 3. |
| Emissions by type of equipment | Bar chart: which types of equipment weigh the most. |
| Top emitters (hotspots) | Your main sources, ranked, with volume in tCO₂e and percentage of the total. |
| Calculation history | A trend line of your emissions (Scope 1, Scope 2, total) over time. |
Projection and target
At the bottom of the dashboard, dAio anticipates your trajectory:
- End-of-year projection — an estimate of the annual total based on the observed pace, with a confidence range (±15%).
- Target — your annual target in tCO₂e and your progress. If no target is set, enter it directly in the dedicated card.
- Comparison with the previous year — variation as a percentage, in green if you are decreasing, in red if you are increasing.
Tip: focus your efforts on the hotspots. Reducing your three largest sources often has more impact than multiplying small actions.
The module's tabs
The module is organized into tabs, each covering a stage of the measurement cycle. The dedicated pages detail each function.
| Tab | Role | Learn more |
|---|---|---|
| Summary | Carbon dashboard: KPIs, charts, hotspots, projection. | (this page) |
| Equipment | Declare generators, machinery and vehicles; dAio calculates their emissions (Scope 1). | Equipment |
| Invoices | Enter your energy invoices for Scope 2. | Invoices |
| Documents | Import invoices and datasheets as PDFs; the AI extracts the data. | Documents |
| Calculations | Freeze an emissions snapshot, manual or automatic. | Calculations |
| Indirect | Manage Scope 3 (travel, purchases, waste). | Scope 3 |
| Recommendations | AI reduction suggestions, quantified and prioritized. | Recommendations |
| Integrations | CSV import, webhooks and API connectors. | Integrations |
| Reports | Generate the official compliance reports. | Reports |
Snapshots: the basis of every declaration
A snapshot is a frozen calculation of your emissions at a point in time. It serves as the foundation of the entire compliance chain:
- Compliance — regulators (UAE MOCCAE, CSRD, SEC) require dated, traceable figures.
- Audit — a third-party auditor verifies a snapshot, not a moving dashboard.
- Tracking — compare your emissions from one period to another on stable bases.
- Reports — every official report is based on a snapshot.
You can create a snapshot manually from the Summary (Calculate a snapshot) or schedule automatic generation (monthly, quarterly, biannual or annual) from the Calculations tab.
Report generation: compliance on demand
The Reports tab produces audit-ready PDF documents from templates tailored to your country and to the targeted framework (CSRD, MOCCAE, SEC, etc.). Each report includes an AI-written analysis that puts your figures in context.
Warning: generating a report consumes AI credits (50 credits per report), as does generating recommendations. The cost and your remaining quota are recalled before each generation, and you must confirm. Keep an eye on your balance in your subscription.
Once generated, a report follows a status cycle: draft → final → submitted. Moving to a higher status is irreversible, in order to guarantee regulatory traceability.
Typical workflow
For a first end-to-end carbon footprint:
- Declare your equipment in the Equipment tab — or import their datasheets as PDFs via Documents.
- Add your energy invoices in Invoices to cover Scope 2.
- Enter your operating hours: equipment without annual hours produces no calculated emissions (a warning flags this for you).
- Complete Scope 3 in Indirect (travel, purchases).
- Calculate a snapshot from the Summary to freeze your figures.
- Analyze the hotspots and generate reduction recommendations.
- Produce your official report in Reports, then finalize it.
Best practices
- Enter data regularly — your invoices and figures rather than all at once at year-end: the projection and trend only become reliable with a populated history.
- Complete the annual hours for each equipment item: without them, their emissions stay at zero and distort your total.
- Schedule your automatic snapshots to always have an audited baseline, with no manual intervention.
- Set an annual target from the start: it turns the dashboard into a steering tool, not just a record.
- Check the data extracted by the AI from your PDFs before calculating: the extraction shows a confidence score — verify the sensitive values.
- Anticipate your AI credits ahead of a regulatory deadline: generating several reports consumes them each time.
Tip: once your first snapshot is calculated, explore the recommendations to move from measurement to action — that is where the module creates the most value.